Engineering Lab Note: Modeling Multi-Year SaaS Economics Locally | TiltStack
Engineering Lab Note #06: The Zero-Server Financial Sandbox
In my 14 years of building systems, I’ve seen that the most sensitive data in your organization isn’t just your code; it’s your growth model. Your MRR trajectories, your churn rates, and your LTV/CAC ratios are the blueprints of your business's viability. Yet, founders often plug these exact numbers into "Free Growth Calculators" that are essentially data-collection engines for venture capital scouts or competitors.
When someone says "The cloud is just someone else's computer," they’re right. And you shouldn't be modeling your business's financial future on someone else's computer.
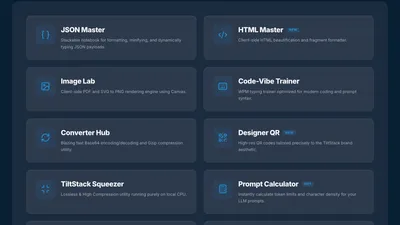
When we built the TiltStack SaaS Economics tool, we decided to apply our Zero-Server Philosophy to financial modeling. It’s an architecture where your data lives in your browser's RAM, not on our servers.
The Physics of Financial Modeling
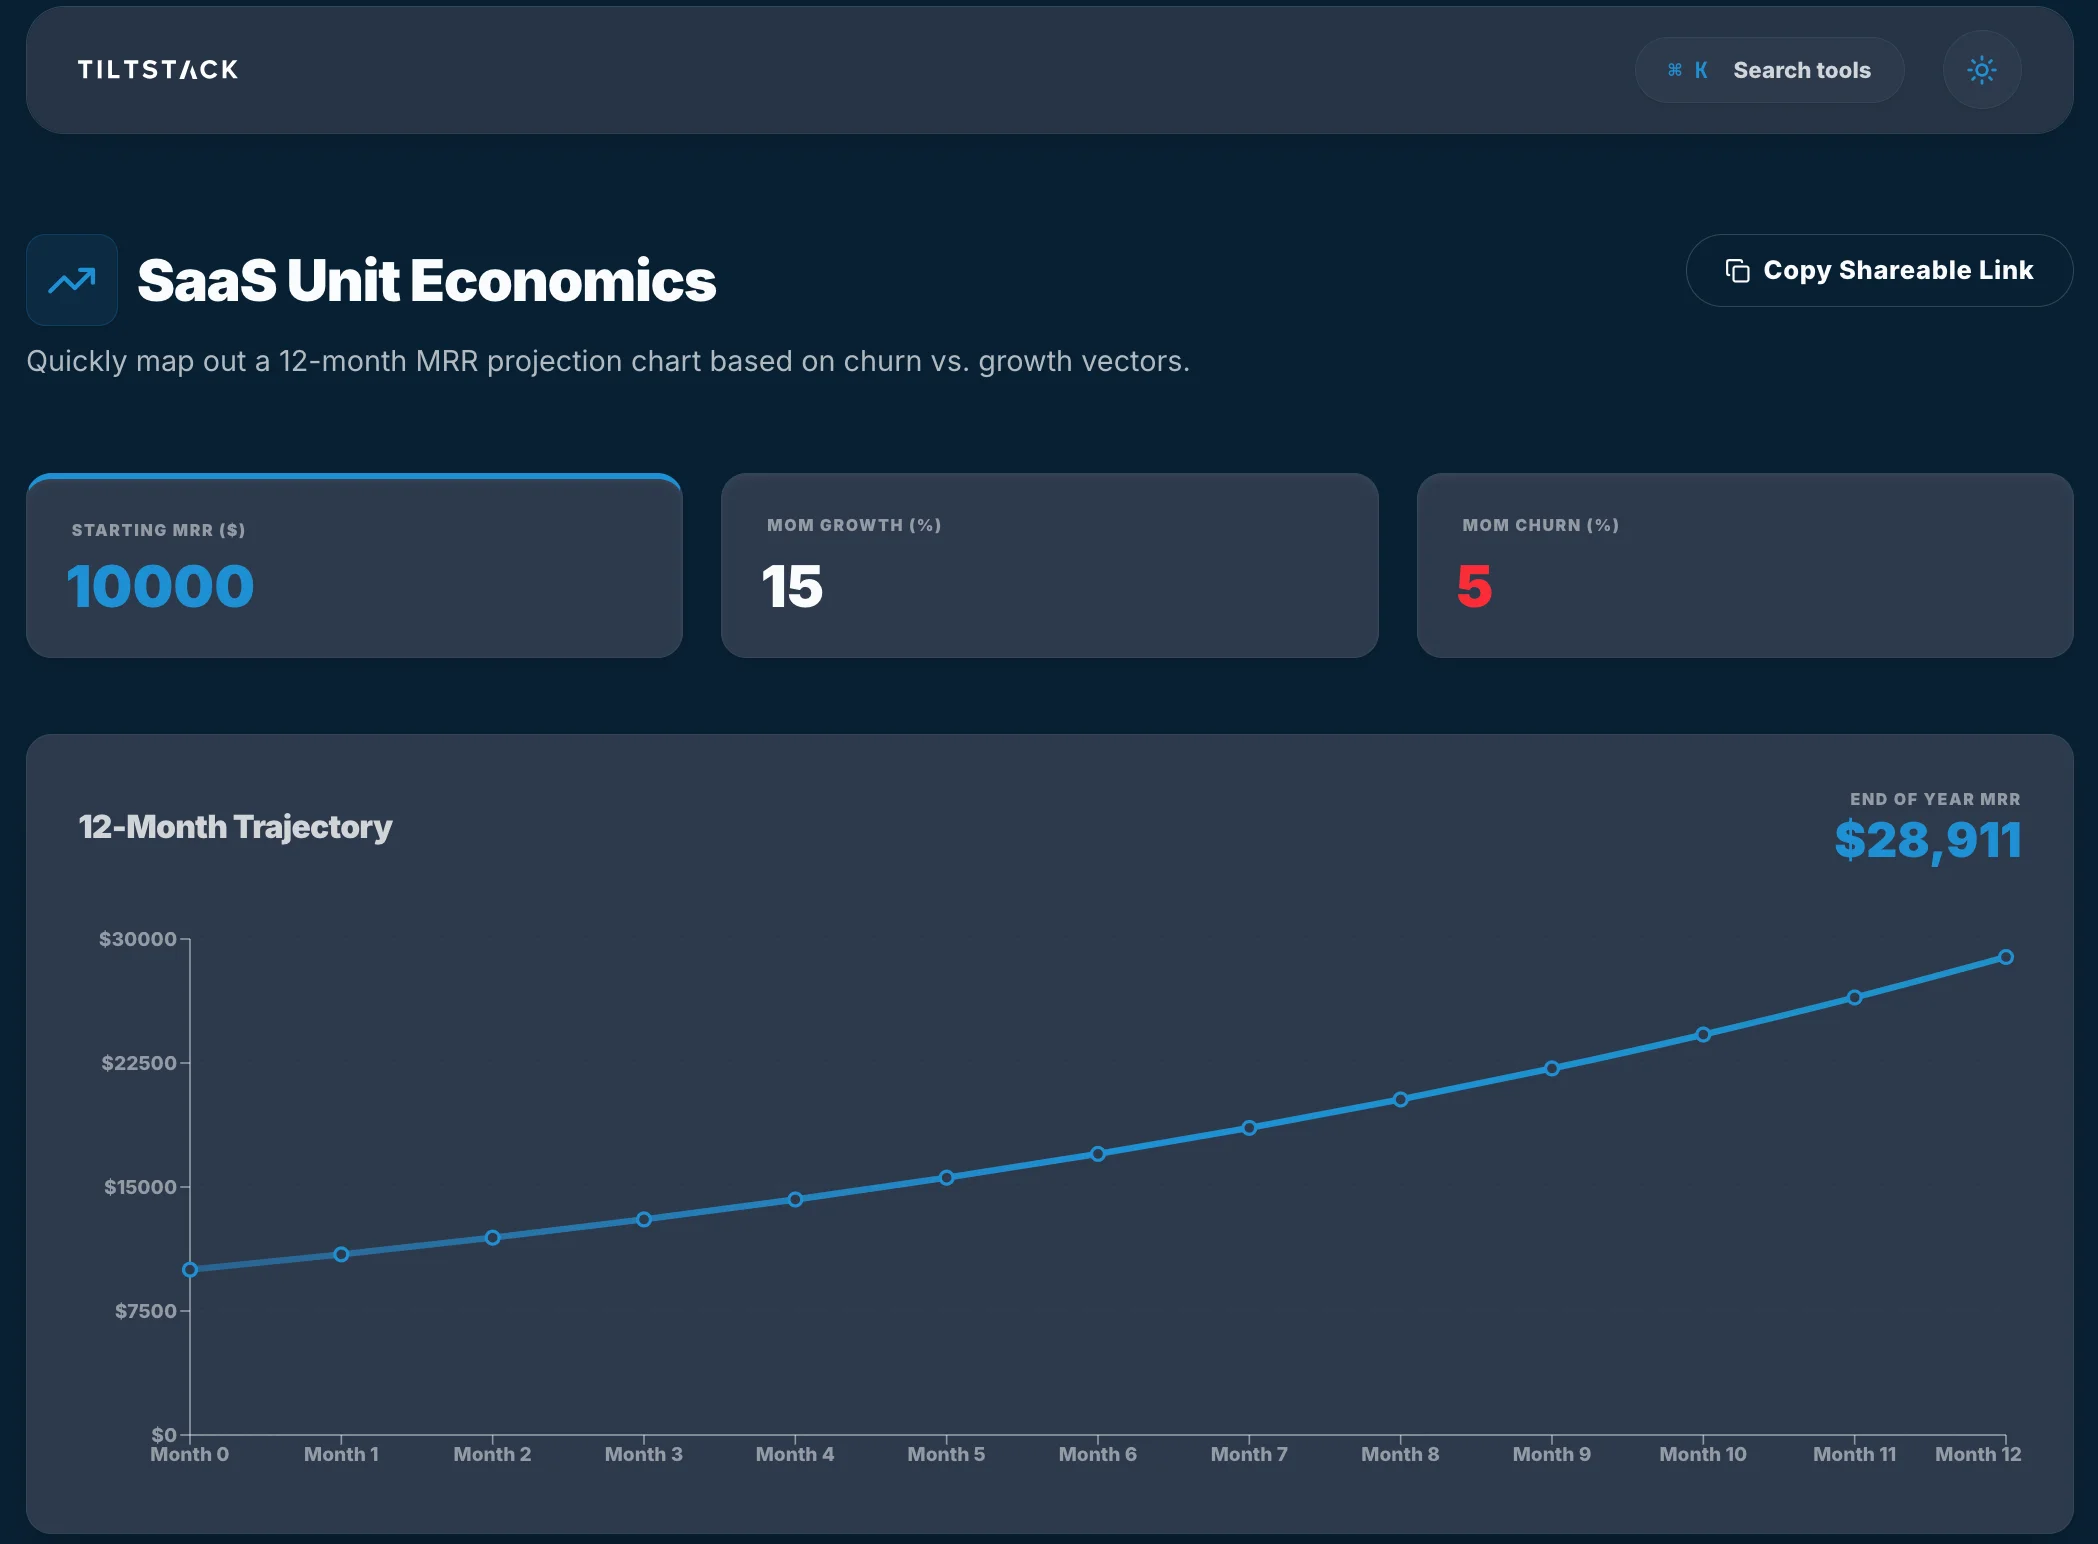
Modeling 12 to 24 months of MRR isn't a simple calculation; it’s an iterative simulation. You have to account for compounding growth, decaying churn, and expansion revenue loops. Most online calculators are just "black boxes" that take a few inputs and spit out a graph.
The DevSuite implementation uses a purely deterministic, iterative model. Because we don't have to wait for a database to save or fetch your inputs, we can perform real-time simulations. As you slide a churn-rate slider, the entire 24-month projection is recalculated and redrawn locally in sub-milliseconds.
Handling Sensitive Persistence
The problem with a "zero-server" financial tool is persistence. If you spend three hours modeling out a complex expansion-revenue pivot, you don't want to lose that work when you refresh the page.
Instead of a traditional POST /user_models endpoint, we use the Web Storage API. This allows us to persist your complex financial objects locally on your machine.
// Local-first persistence logic
interface ModelState {
  mrr: number;
  churn: number;
  acv: number;
  // ...other confidential fields
}

function saveModelLocally(state: ModelState) {
  // Encrypt locally if necessary, but keep it on the client
  localStorage.setItem('tiltstack_saas_model', JSON.stringify(state));
}
This ensures that your model stays exactly where it belongs: in your browser's storage. It's visible to you, but it's completely invisible to us. We have no backend to breach, which means there's no central database that could ever leak your unit economics.
Visualizing Growth Locally with Chart.js
Visualizing these growth loops is critical for decision-making. We use a customized implementation of Chart.js that renders the SVG/Canvas data locally.
When a typical "SaaS Tool" renders a graph, it often sends the raw data back to a server-side rendering service to generate a PNG. This is slow and a privacy risk. We render every pixel of your growth trajectory in your browser's canvas context. This means the speed of your financial modeling is limited only by your own GPU/CPU, not by your internet connection.
The Privacy Moat
By modeling your SaaS economics in a zero-server sandbox, we guarantee:
- Zero Exposure: Your MRR and CAC stayed local. No logs. No traffic analysis.
- Extreme Speed: Real-time recalculation of complex growth models.
- Total Ownership: You can export your model as a raw JSON file and take it with you.
At TiltStack, we believe architectural integrity is the ultimate form of business security. Your unit economics are your own. Stop modeling your business on someone else's infrastructure.